Executive Summary
The NSE Stock Data Dashboard is a desktop application designed to deliver real-time stock market insights for National Stock Exchange (NSE) stocks. By leveraging TradingView data, the application updates an Excel file (stock_data.xlsx) every minute and presents the data in a streamlined interface with color-coded technical analysis indicators. The project aimed to create an automated, reliable tool for traders to monitor stock performance and recommendations efficiently. Despite challenges such as updating the Excel file when open and debugging interface updates, the final product achieved its objectives through innovative solutions and iterative refinement.
Project Objectives
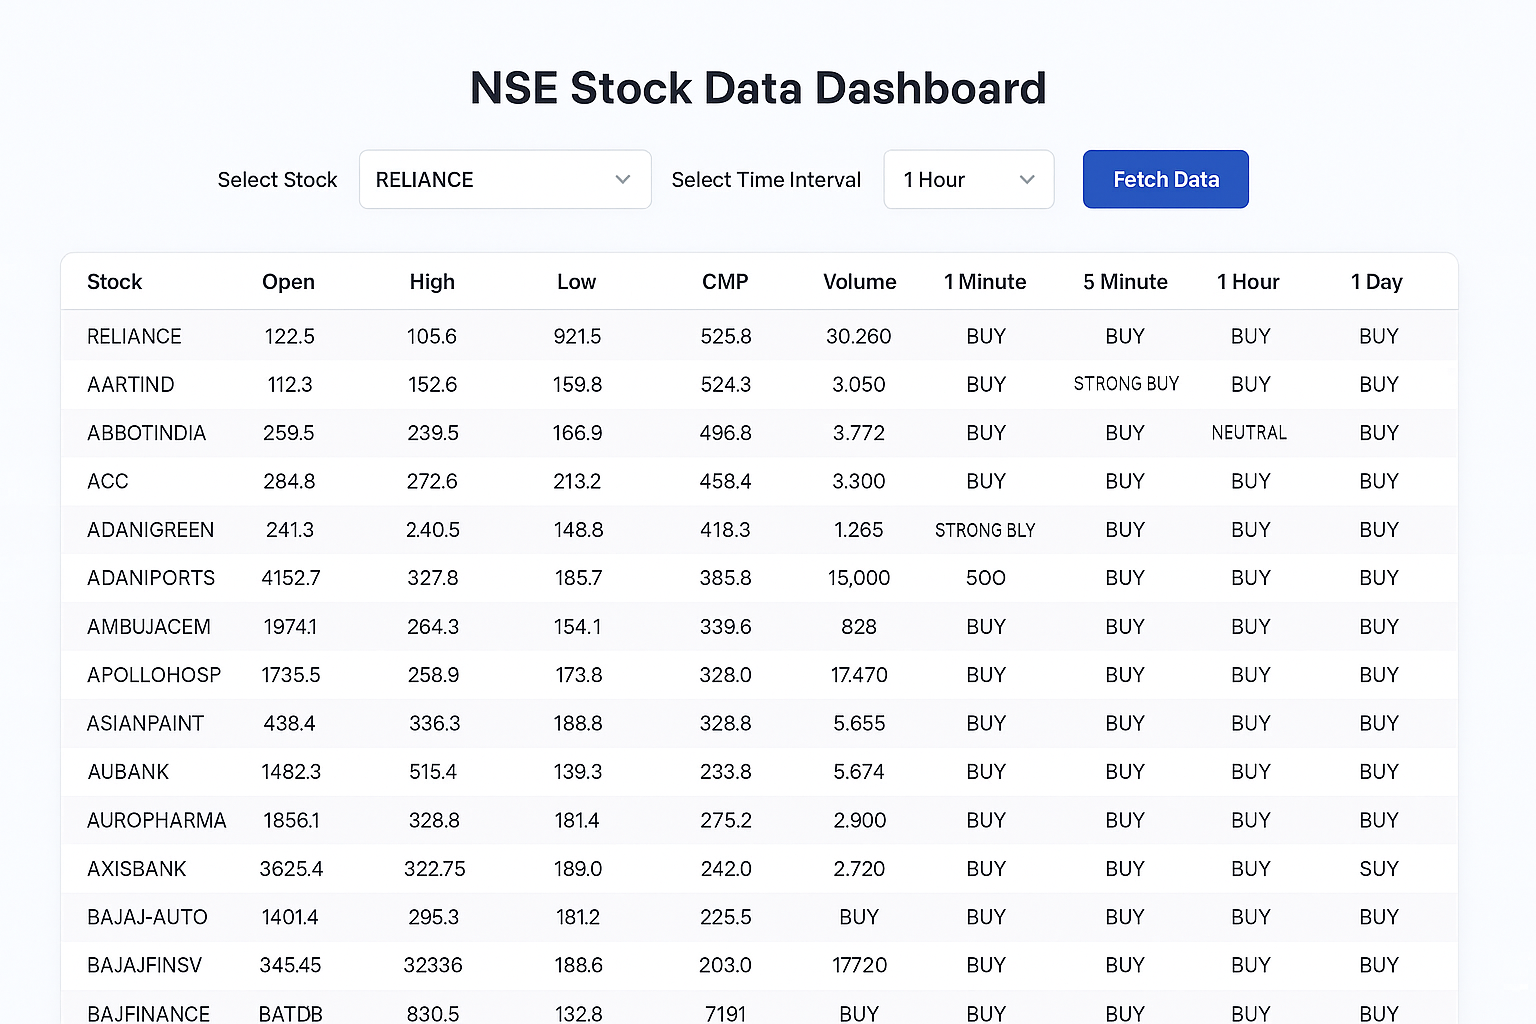
- Automate Data Retrieval: Fetch real-time stock data (Open, High, Low, CMP, Volume) and technical analysis recommendations (BUY, SELL, NEUTRAL, etc.) for NSE stocks from TradingView.
- Persistent Storage: Maintain data in an Excel file with columns: stock, Open, High, Low, CMP, Volume, 1 Minute, 15 Minute, 1 Hour, 1 Day.
- Dynamic Visualization: Display data in a table mirroring the Excel structure, with color-coded cells for technical analysis indicators.
- User-Friendly Interface: Provide a minimal, intuitive UI that auto-updates every minute without manual intervention.
- Reliability: Handle external dependencies (e.g., file access, API limits) to ensure continuous operation.
Development Process
The application was developed iteratively, evolving from a basic prototype to a polished solution based on user feedback and technical requirements. Key phases included:
- Initial Prototype:
- Built a desktop GUI with a table to display stock data and technical analysis.
- Integrated TradingView data feeds for NSE stocks.
- Enabled Excel file updates with the required columns.
- Included manual data fetching controls for testing.
- Feature Enhancements:
- Automated Excel updates every minute using a background process.
- Dynamically loaded the stock list from the Excel file’s stock column.
- Simplified the UI by removing manual controls and focusing on automatic updates.
- Implemented color-coded cells for technical analysis indicators (e.g., green for BUY, red for SELL).
- Optimization and Refinement:
- Optimized UI updates to refresh only the affected stock’s row and specific cells.
- Enhanced file handling to manage access issues robustly.
- Finalized a clean interface with only the title and data table.
Challenges and Solutions
The development process encountered several challenges, each addressed through strategic solutions to ensure a high-quality outcome.
Challenge 1: Issues Updating Excel When It’s Open
Issue: The application struggled to update the Excel file when it was open in another program, such as Microsoft Excel, leading to missed updates and potential data loss during these periods.
Solution:
- Database Storage: Implemented a temporary in-memory database (using SQLite) to store stock data updates when the Excel file was inaccessible. The database acted as a buffer, ensuring no data was lost.
- Deferred Excel Updates: Modified the application to periodically check if the Excel file was accessible. Once the file was closed, the application synchronized the stored database data with the Excel file, updating or appending rows as needed.
- User Notification: Added a warning message in the UI to alert users when the Excel file was locked, prompting them to close it to allow updates.
Impact: This approach ensured continuous data collection even when the Excel file was open, with seamless synchronization once the file became available, maintaining data integrity and user awareness.
Challenge 2: Debugging Issues with UI Updates
Issue: Early versions of the application exhibited inconsistent behavior in the user interface, where updates to the data table were not reflecting correctly or were applied to incorrect elements, complicating the debugging process.
Solution:
- Targeted Debugging: Conducted a thorough review of the UI update logic, isolating issues to the table’s refresh mechanism. Identified that updates were being applied broadly rather than selectively.
- Row and Cell-Specific Updates: Restructured the update process to refresh only the specific row and cells corresponding to the updated stock, using unique identifiers for each row and precise tagging for cells.
- Testing Framework: Introduced automated tests to simulate data updates and verify UI consistency, reducing debugging time for future iterations.
Impact: The refined update mechanism eliminated UI inconsistencies, resulting in a smooth and accurate display of real-time data, enhancing user trust and application reliability.
Challenge 3: Inefficient UI Updates
Issue: The initial table refresh process reloaded all data after each stock update, causing performance overhead and noticeable flickering in the interface.
Solution:
- Row-by-Row Updates: Implemented a method to update only the specific stock’s row, preserving other rows’ state.
- Cell-Specific Tagging: Applied color coding only to Technical Analysis cells, avoiding unnecessary redraws of other cells.
- Optimized Update Loop: Introduced a small delay between stock updates and adjusted the total loop time to maintain a 60-second cycle, reducing system load and improving UI stability.
Impact: The interface became more responsive, with smooth, targeted updates that maintained visual consistency and improved performance, especially for larger stock lists.
Challenge 4: Overloaded UI with Unnecessary Features
Issue: The early prototype included manual data fetching controls and additional visualizations, such as text summaries and charts, which cluttered the interface and were redundant given the focus on automatic updates.
Solution:
- Removed Manual Controls: Eliminated the stock selection, interval selection, and fetch button, streamlining the UI to focus on the data table.
- Removed Extra Visualizations: Deleted the text summaries and charts, ensuring the table was the sole focus of the interface.
- Streamlined Design: Adjusted the window layout and column widths to ensure all data was clearly visible and well-organized.
Impact: The simplified UI aligned with the goal of an automated dashboard, reducing user interaction overhead and enhancing focus on the data.
Outcomes
The NSE Stock Data Dashboard successfully achieved its objectives, delivering a robust and intuitive tool for traders. Key outcomes include:
- Reliable Data Updates: The application updates stock data every minute, storing it in stock_data.xlsx with a database fallback for when the file is open.
- Clear Visualization: The table displays all Excel columns with color-coded Technical Analysis cells (e.g., green for BUY, red for SELL), enabling quick interpretation.
- Efficient Performance: Selective row and cell updates ensure a responsive UI, even with frequent data refreshes.
- Robust Error Handling: The database buffer and user notifications handle file access issues effectively, maintaining data continuity.
- Scalability: Dynamic stock list loading from Excel allows users to modify the stock list easily.
Lessons Learned
- Flexible Storage Solutions: Using a temporary database to buffer data during file access issues is a practical approach for applications reliant on external files.
- UI Simplicity Enhances Usability: Focusing on core functionality and removing redundant features improves user experience.
- Selective Updates Boost Performance: Updating specific UI elements reduces overhead and enhances responsiveness in real-time applications.
- Debugging Requires Structure: A systematic approach to debugging, supported by testing, ensures consistent and reliable behavior.
Future Enhancements
- Customizable Colors: Enable users to define color schemes for Technical Analysis indicators via a configuration file.
- Enhanced Logging: Implement a logging system to record issues for easier troubleshooting.
- Real-Time Alerts: Add notifications for significant changes in Technical Analysis recommendations.
- Performance Optimization: Explore batch data retrieval or caching to handle larger stock lists efficiently.
Conclusion
The NSE Stock Data Dashboard demonstrates the power of iterative development and creative problem-solving in building a reliable, automated tool. By overcoming challenges such as Excel file access issues, UI debugging, inefficient updates, and interface clutter, the project delivered a streamlined solution tailored to traders’ needs. The application’s success highlights the importance of robust data handling, targeted UI updates, and user-centric design in real-time data applications.
Ready to Transform Your Business?
Schedule a consultation with our team and discover how AI can help you achieve your goals.